
As a longtime college basketball fan, my favorite month has always been March because of the annual men’s and women’s national basketball championship tournaments held by the NCAA® during the month.
Every year, millions of sports fans bet on predicting the winners of these tournaments. The goal of this article is to show you how data analytics can be your best tool for selecting this year’s national champions.
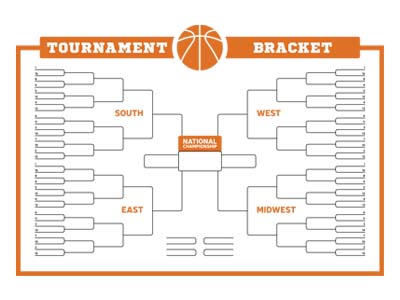
The Bracket
Both the men’s and women’s tournaments are single-elimination playoffs and include 68 teams (expanded from 64 teams in 2011). The teams are chosen by a selection committee based on several criteria, including strength of schedule, strong wins vs. good losses, and current team trajectory.
These lucky 68 teams are matched up according to their rankings, or “seeds,” which are also determined by the selection committee. (I say “lucky” because every year some teams with strong credentials don’t get selected for the tournament, and instead are invited to compete in the National Invitational Tournament). The matchups form a standard playoff bracket, in which the victors in each round proceed to the next until there are only two teams left to compete for the national championship.
When a lower-ranked team upsets a higher seed, which happens in every tournament, one’s hopes of picking the champions can be instantly dashed. The perceived unpredictability of the tournament causes fans to go mad with frustration, elation, confusion, sadness, shock, and other emotions all too familiar to the sports enthusiast.
Data Analytics: A Better Approach to Predicting
One thing that I have learned over the years is that choosing winners using emotion and sentiment rather than logic and data will greatly hinder your bracket’s success rate. For those who are serious about winning their bracket, I highly recommend avoiding that approach.
Instead, you can use data analytics as a tool for building your strongest bracket and giving you a greater chance for selecting this year’s winner. Data analytics is the science of analyzing raw data to make conclusions about information. While it is extremely rare for someone to accurately select the winners of every single round of a tournament, using data analytics can help even the most unsophisticated basketball fan develop a fundamentally stronger bracket and improve their chances of determining the final outcome.
UMGC data analytics professor Chris Schultz offers some of his expertise and thoughts.
“Constructing a tournament bracket is somewhat like building a predictive analytics model. Your model will only be as good as the data you use to build it. But basketball stats are complex and nuanced and will require looking beyond the numbers,” says Schultz.
Selecting Useful Data
Shultz recommends that, before making your picks, it is important to identify criteria that you want to assess and how far back you want to go. Analyzing historical tournament data, like past team performance in the tournament, can help you identify patterns and trends that may influence how you start your selection process.
“You can look at seed rankings for a team, such as how a team has performed when it was the higher seed vs. lower seed,” says Schultz. “One can also look at the team’s scoring margins over the last 10 games before the tournament and how the team performed in previous tournaments. The good news is most of this information can be found on a number of sports websites.”
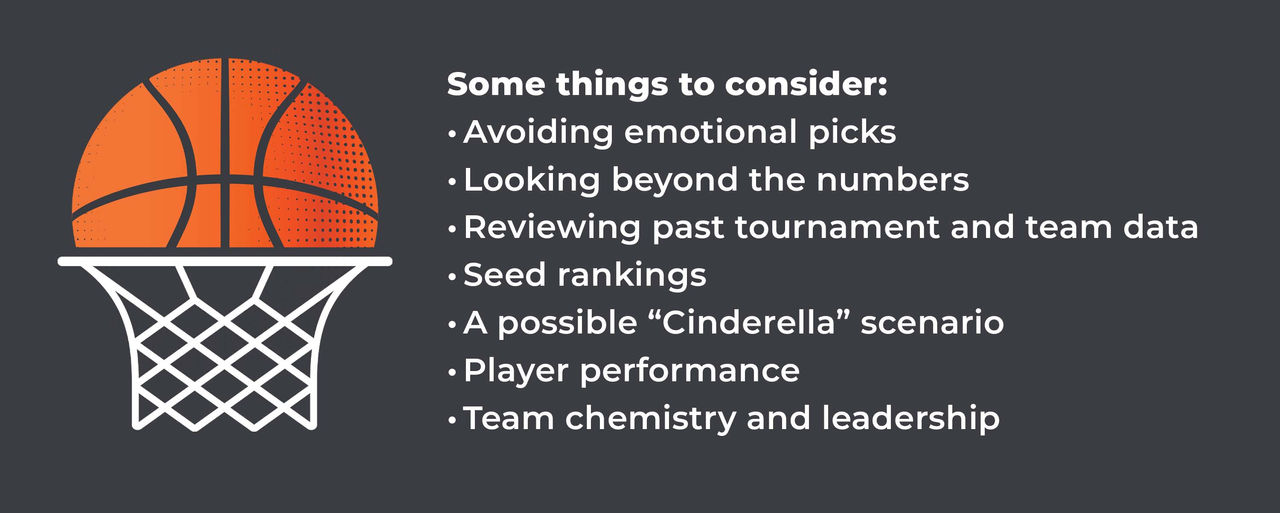
For example, you may want to predict the number of upsets that will occur in this year’s tournament. A review of past tournament and team data shows that the annual average is 12.4 upsets per tournament. There have been as few as four upsets (2007) and as many as 19 (2014), but the sweet spot is typically somewhere in between. Underdog teams who excel in a given tournament are often called “Cinderella teams.”
Knowing this information, you can examine this year’s group of 68 teams and see if any of them has been a Cinderella team in the past. Some recent Cinderella teams who made it all the way to the men's semi-finals include George Mason University in 2006, Virginia Commonwealth University in 2011, and Loyola University Chicago in 2018.
Digging Deeper with Player and Team Metrics

In addition to historical tournament data, it’s important to examine specific player and team statistics to assess which ones are competing at the highest levels entering the tournament. Performance metrics such as points per game, field goal percentage, and assists-to-turnover ratio can help you identify key contributors and potential game-changers. Go back and look at what a game-changing player like Steph Curry was able to do when he took Davidson deep into the tournament or Dwayne Wade taking Marquette within reach of the finals, or in 2023 when Jordan Hawkins caught fire and brought home the championship for the UConn Huskies. And on the women’s side, the Iowa University phenom, Caitlin Clark, actually took her team all the way to the finals last year where she played against an equally strong Angel Reese at LSU.
You can also look at teams who have shown great chemistry and leadership and are playing their best basketball at the end of the season. Stats such as offensive and defensive efficiency, three-point shooting percentage, rebounding rates, and turnover margins offer valuable insights into team strengths and weaknesses. These can help you compare teams in all the potential matchups they face in the tournament.
Schultz adds, “Odds are, like everyone else’s bracket, yours will get busted before the end of the tournament—maybe even in the first round. But the process of researching teams and players, both quantitatively and qualitatively, is also a way of understanding the game a bit better and could increase your enjoyment of watching the games, whether or not your predictive analytics mesh with the results on the court.”

Are You Ready to Select This Year’s College Basketball Champions?
While the tournaments will remain unpredictable and full of surprises, data analytics offers you a data-driven approach to navigate the excitement and uncertainty of college basketball's premier event. Best of luck with your tournament brackets and may the best data assessor win!
Reference on this webpage to any third-party entity or product does not constitute or imply endorsement by UMGC nor does it constitute or imply endorsement of UMGC by the third party.

/blog-umgc-degrees-data-analytics-linklist-shutterstock-1840534423.jpg)