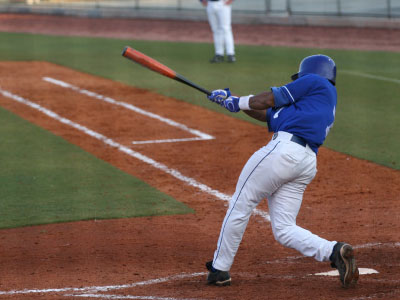
Baseball is the ultimate data-based sport comprising every type of metric and stat there is—from sabermetrics (the application of statistical analysis to baseball records in order to evaluate and compare the performance of individual players) to Billy Beane’s analysis of a player’s value to get on base (check out the book Moneyball by Michael Lewis).
By compiling stats and breaking down data to forecast metrics of a player’s career, you can make a case for how much impact their stats can or will have on a team’s next game or even on an entire season.
Trust me, if you want to pursue a career as a data analyst, this is the sport for you—and you can start with baseball’s statistical best: the homerun hitter.
Hitting a homerun is a big deal. It shows incredible coordination and power, an impressive feat that just about every baseball fan covets to experience. That’s why the Home Run Derby—a home run hitting competition featuring MLB’s mid-season leaders in home runs leading up to its annual All-Star Game—is the attraction that it is today.
More than 7.1 million people watched the 2021 Home Run Derby, which culminated in a final duel between Pete Alonso of the National League’s Mets and Trey Mancini of the American League’s Orioles. Alonso, with his incredibly powerful swing, won the heated contest, crushing 23 homers in the final round. After winning this star-studded battle, you might wonder if the momentum from his individual feat would translate to a win for the National League team in the All-Star Game. Well, in this case, it did not. The American League All-Stars prevailed with a 5-2 victory.
Does the Home Derby Champion Determine the MLB All-Star Game Winner?
 This relationship between the Home Run Derby and the MLB All-Star Game brings up a very interesting question about the correlation between winning a highly competitive individual contest and winning a team-focused event.
Surely, the data from one “once-a-year contest” can show definitively the expected result for one “once-a-year game,” right? Let’s dig in.
Since the inaugural MLB All-Star Game in 1933, there have been 91 All-Star Games played. The American League has recorded 46 victories and the National League has recorded 43 (there were two ties).
The MLB introduced the Home Run Derby to the All-Star Game festivities in 1985. The winner that year was Dave Parker from the Cincinnati Reds, a National League team. The National League also won the All-Star Game. In 1986, Darryl Strawberry of the National League’s Mets and Wally Joyner of the American League’s Angels shared the Derby crown, but the American League won the 1986 All-Star Game.
Then, from 1987 to 2021, the National League won only seven All-Star Games while the American League won 26 (with one tie and one cancellation due to COVID). During this time, there were 14 National League Home Run Derby winners and 20 American League Home Run Derby winners (with two cancellations).
Here is the full breakdown of Home Run Derby winners and All-Star Game team winners from 1985 to 2021.
| Year | Home Run Derby Winner | All-Star Game Team Winner | Match |
| 1985 | Dave Parker (NL) | NL Team | + |
| 1986 | Wally Joyner (AL)/Darryl Strawberry (NL) | AL Team | |
| 1987 | Andre Dawson (NL) | NL Team | + |
| 1988 | CANCELED (RAIN) | AL Team | |
| 1989 | Eric Davis (NL)/Ruben Sierra (AL) | AL Team | |
| 1990 | Ryne Sandberg (NL) | AL Team | |
| 1991 | Cal Ripken J. (AL) | AL Team | + |
| 1992 | Mark McGuire (AL) | AL Team | + |
| 1993 | Juan Gonzalez (AL) | AL Team | + |
| 1994 | Ken Griffey Jr. (AL) | NL Team | |
| 1995 | Frank Thomas (AL) | NL Team | |
| 1996 | Barry Bonds (NL) | NL Team | + |
| 1997 | Tino Martinez (AL) | AL Team | + |
| 1998 | Ken Griffey Jr. (AL) | AL Team | + |
| 1999 | Ken Griffey Jr. (AL) | AL Team | + |
| 2000 | Sammy Sosa (NL) | AL Team | |
| 2001 | Luis Gonzalez (NL) | AL Team | |
| 2002 | Jason Giambi (AL) | TIE | |
| 2003 | Garret Anderson (AL) | AL Team | + |
| 2004 | Miguel Tejada (AL) | AL Team | + |
| 2005 | Bobby Abreu (NL) | AL Team | |
| 2006 | Ryan Howard (NL) | AL Team | |
| 2007 | Vladimir Guerrero (AL) | AL Team | + |
| 2008 | Justin Morneau (AL) | AL Team | + |
| 2009 | Prince Fielder (NL) | AL Team | |
| 2010 | David Ortiz (AL) | NL Team | |
| 2011 | Robinson Cano (AL) | NL Team | |
| 2012 | Prince Fielder (AL) | NL Team | |
| 2013 | Yoenis Cespedes (AL) | AL Team | + |
| 2014 | Yoenis Cespedes (AL) | AL Team | + |
| 2015 | Todd Frazier (NL) | AL Team | |
| 2016 | Giancarlo Stanton (NL) | AL Team | |
| 2017 | Aaron Judge (AL) | AL Team | + |
| 2018 | Bryce Harper (NL) | AL Team | |
| 2019 | Pete Alonso (NL) | AL Team | |
| 2020 | CANCELED (COVID) | CANCELED (COVID) | |
| 2021 | Pete Alonso (NL) | AL Team |
In the 32 years from 1987 to 2021 when there was no tie, cancellation of a game, or a Home Run Derby champion from each league, the Home Run Derby champion and the All-Star Game team winner matched up 15 times (47%). And the Home Run Derby champion did not influence the winner of the All-Star Game 17 times (53%).
The numbers show that—while close—having the Home Run Derby champion on your All-Star team does not directly impact the team’s actual performance and chance of winning the All-Star Game.
Now, with all that said, there is a new twist that MLB baseball voted on this year. According to the Associated Press, “If the All-Star Game remains tied after nine innings, the game will be decided by a Home Run Derby between the teams, subject to the parties’ agreement on details and format.”
It will be fun to see how this unfolds and what kind of new data we can obtain from these changes to baseball’s All-Star Game in the future. My guess is that this new amendment could turn our current Home Run Derby impact analysis upside down moving forward. But only the data scientists really know.
 Interested in Studying Sports Analytics? It's a Growing Industry.
Analyzing the influence of the Home Run Derby champion on the result of the MLB All-Star Game might seem like an exercise restricted to just a few sports with no general implications, but that conclusion couldn’t be further from reality.
Data analytics continues to draw massive team management interest and considerable financial investment across multiple sports, and this trend continues to grow.
Christopher Schultz, PhD, UMGC collegiate professor of data analytics, offers the following insight: “Recent projections suggest that the global market for sports analytics will reach $4.6 billion by 2025, all sports combined. Soccer is not surprisingly in first place, considering its global reach, but baseball, along with basketball are in the top three. We’re looking at a growth rate of over 30 percent annually, which clearly establishes sports analytics as a huge growth market for investment, but also for employment opportunities.”
Explore your opportunities in this growing field. Learn more about UMGC’s data analytics programs today.


/blog-artificial-intelligence-bachelors-degree-umgc-linklist-shutterstock-2577940083.jpg)
/blog-banner-linklist-ai-certificate-degree.jpg)